Author: Woo X Research
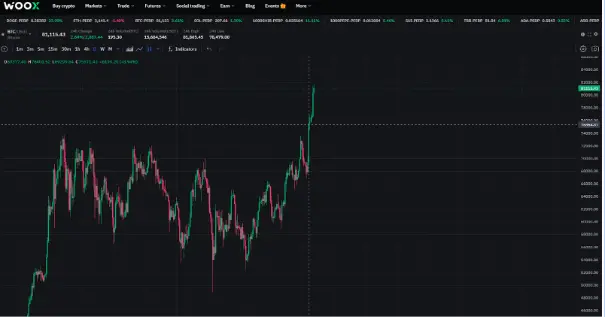
On November 6, Bitcoin broke out of a six-month consolidation range and broke through $73,000. The reason behind this is closely related to Trump's victory in the election and the start of the interest rate cut cycle.
- Trump wins the election: He promised to make a number of crypto-friendly policies before the election, including making the United States the global capital of cryptocurrency and firing the current SEC chairman. Although it is uncertain whether he can fulfill his promises after taking office, it is foreseeable that the crypto market has often faced regulatory pressure in the past. This situation will be alleviated after Trump takes office, which is undoubtedly the main factor driving the market upward.
- The interest rate cut cycle begins: The interest rate cut means that the United States releases more liquidity to the risk market, which will theoretically lead to a rise in the stock market, other countries' fiat currencies and other asset classes, and Bitcoin, which has the highest risk and relatively small market value, can also benefit from this. In November, the interest rate was cut by one basis point. In terms of traditional finance, the market reacted positively, the S&P closed at a new high, and the bond market rose. The transmission of liquidity often takes time, and 2024 Q4 is leaving the crypto market with the opportunity to take on spillover liquidity.
From the policy side to the capital injection, we are currently in the "early bull" period. Since the previous high point of Bitcoin is the bottom of the new round, we can boldly assume that US$73,000 of Bitcoin is the support price of this bull market.
The support has been confirmed, so how high can the price of Bitcoin go in this bull market? WOO X Research will take you to find out.
BTC market value compared with other mainstream assets: $110,000 to $220,000
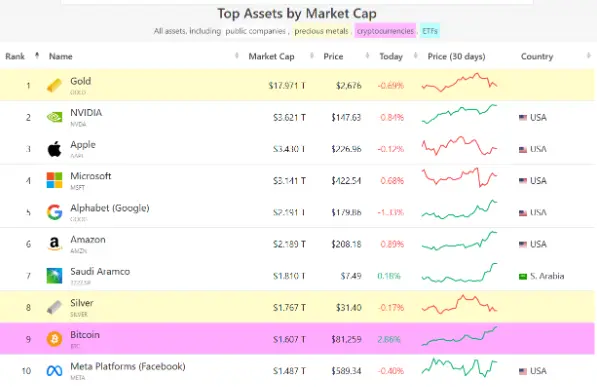
The current market value of Bitcoin is $1.6 trillion. Last month, it surpassed Meta and ranked after silver, becoming the ninth largest asset in the world. Since the Bitcoin spot ETF was approved in January this year, Bitcoin is no longer considered a niche asset, but has become a mainstream asset. With the help of Trump's election, Bitcoin has become more visible to the public, and its growth potential can be compared with other mainstream assets.
As we all know, Bitcoin is also known as digital gold. The current market value of Bitcoin is about 9% of gold. The following simulates several scenarios to estimate the possible future price of Bitcoin:
- If Bitcoin's market value reaches 25% of gold's, which is $4.5 trillion, the price will reach $227,162.
- If the market value of Bitcoin is the same as Nvidia, the price will be $183,645
- If Bitcoin's market value surpasses Google and ranks fifth, the price will reach $111,730
In terms of market value, Bitcoin is expected to enter the top five global assets in this bull market, with an expected top price range of US$110,000 to US$220,000.
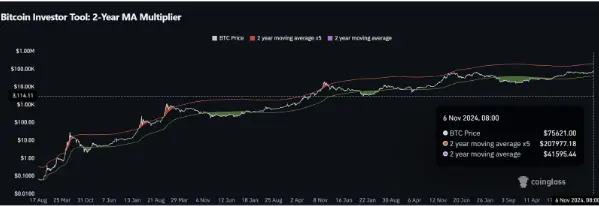
Bitcoin escape top indicator: top at least $200,000
This indicator uses two types of data to make judgments:
- Two-year moving average (730 days, green line)
- Five times the two-year moving average (red line)
How to use:
- When the Bitcoin price is below the two-year moving average (green line), it is a good time to buy Bitcoin.
- When the price exceeds five times the two-year moving average (red line), it is a signal to sell Bitcoin
How to interpret this indicator? It means whether the short-term price breaks through/falls below the average price of long-term holders. The low point is based on the average price over the past two years. If it is below the green line, it means that it has fallen below the low point in the past two years, indicating excessive panic. This is a good long-term buying point.
The red line is five times the average price of the past two years. Once it is broken, it means that the market is too FOMO, which is often a signal of overheating and is suitable for selling.
Reviewing the past price performance of Bitcoin, it roughly conforms to this rule. According to the information in the figure below, the price of Bitcoin was about 75,000 US dollars on November 6, and the red line price was 207,977 US dollars. In recent years, the price of Bitcoin has continued to hit new highs, and the red line price will also rise. This indicator shows that the peak price of this round is at least 200,000 US dollars.
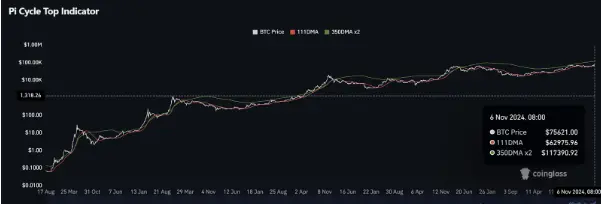
Pi Cycle top indicator: at least $110,000
The indicator uses two sets of data to determine whether Bitcoin is overheated:
- 111-day moving average (111DMA, red line)
- Two times the 350-day moving average (350DMA x 2, green line)
How to use:
When the 111-day moving average moves upward and crosses above twice the 350-day moving average, it usually represents a top in Bitcoin price and is a sell signal.
How to interpret this indicator?
The meaning of the Pi Cycle top indicator is to observe whether the short-term price breaks through the average price of long-term holders, and to judge the degree of overheating of the market. When the 111DMA (red line) breaks through the 350DMA x 2 (green line), it usually means that the market is overly optimistic and FOMO (fear of missing out) appears. It is often an overheated signal and it is suitable to consider selling.
According to the latest chart information, on November 6, 2024, the price of Bitcoin was about $75,621, while the price of 350DMA x 2 was about $117,390. This means that when the price of Bitcoin approaches or exceeds this price, it may be a top signal for this round of market.